Scatter plots are a fantastic tool for visualizing the relationship between two sets of data, helping you identify correlations, trends, and outliers effectively. Whether you're a student analyzing scientific data or a marketer examining user engagement metrics, Google Sheets provides an accessible yet powerful platform for creating scatter plots.
In this blog post, we'll walk through the detailed steps to create a scatter plot in Google Sheets and briefly touch on how tools like SheetAI.app can streamline similar tasks.
What is a Scatter Plot?
A scatter plot (also known as a scatter chart or scatter graph) uses dots to represent values obtained for two different variables - one plotted along the x-axis and the other plotted along the y-axis.
This type of chart is used to observe relationships between variables and is a staple in statistical analysis for identifying correlation coefficients.
Step 1: Prepare Your Data
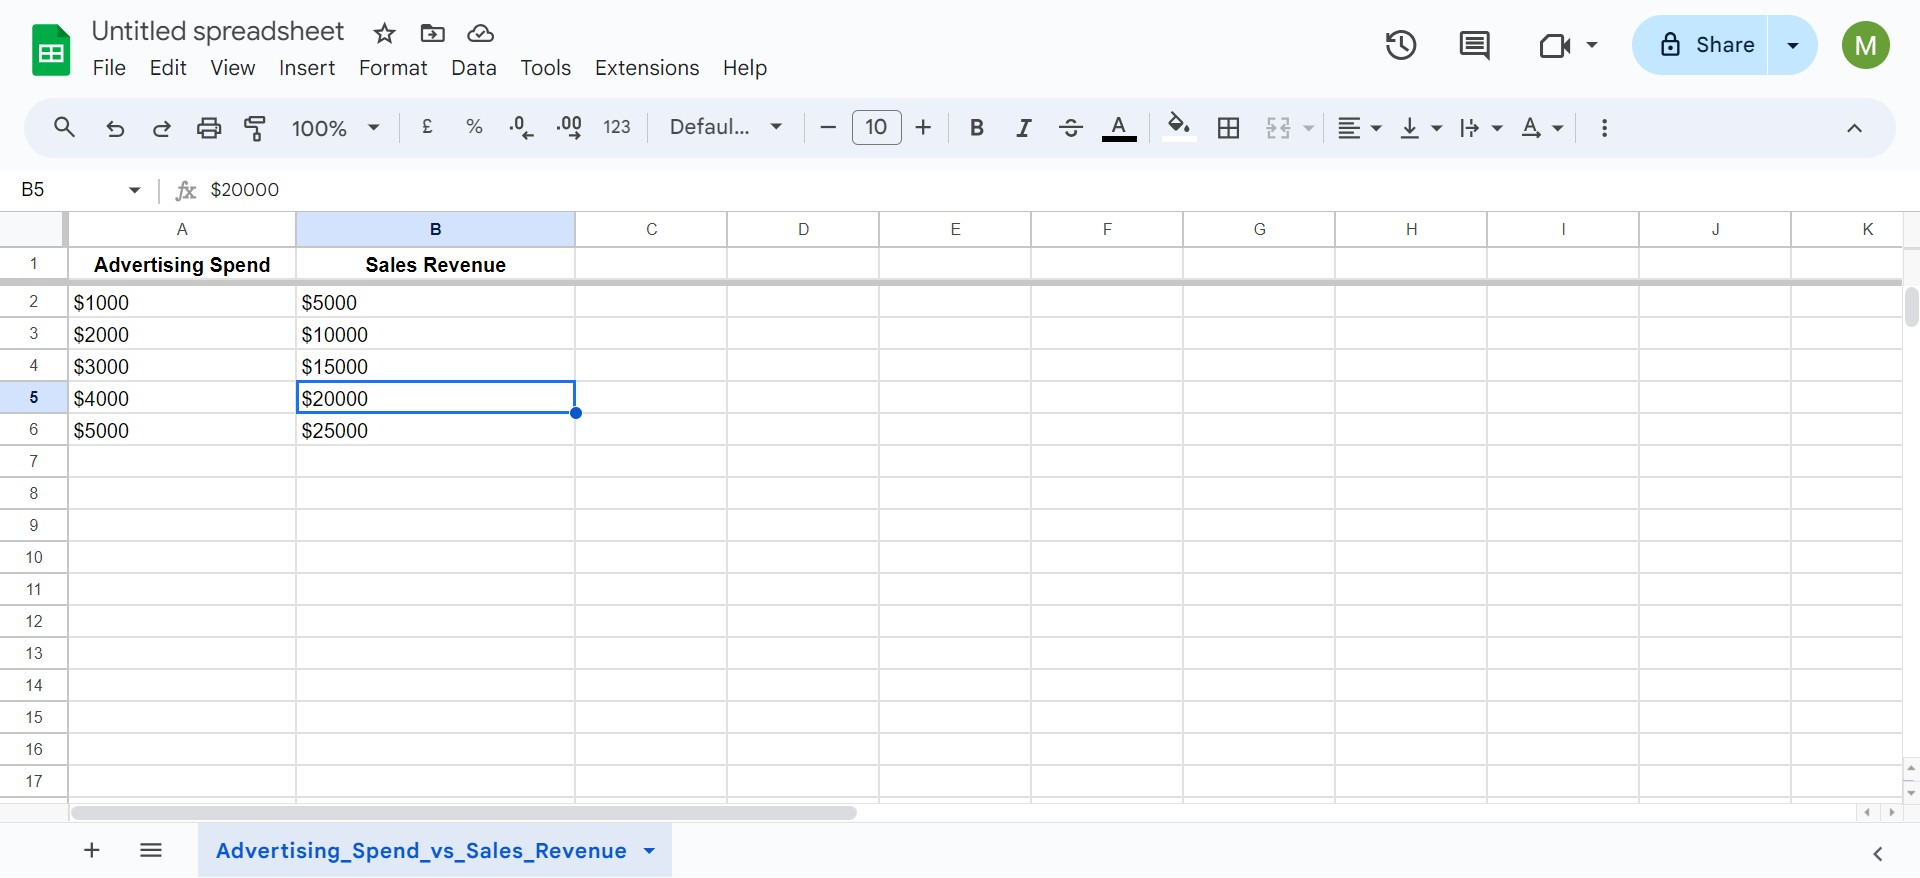
To start, ensure your data is well-organized in Google Sheets. You need two columns: one for each variable you wish to compare.
For example, if you are analyzing the relationship between advertising spend and sales revenue, your columns might be:
Ensure there are no missing values, as this could affect the accuracy and readability of your scatter plot.
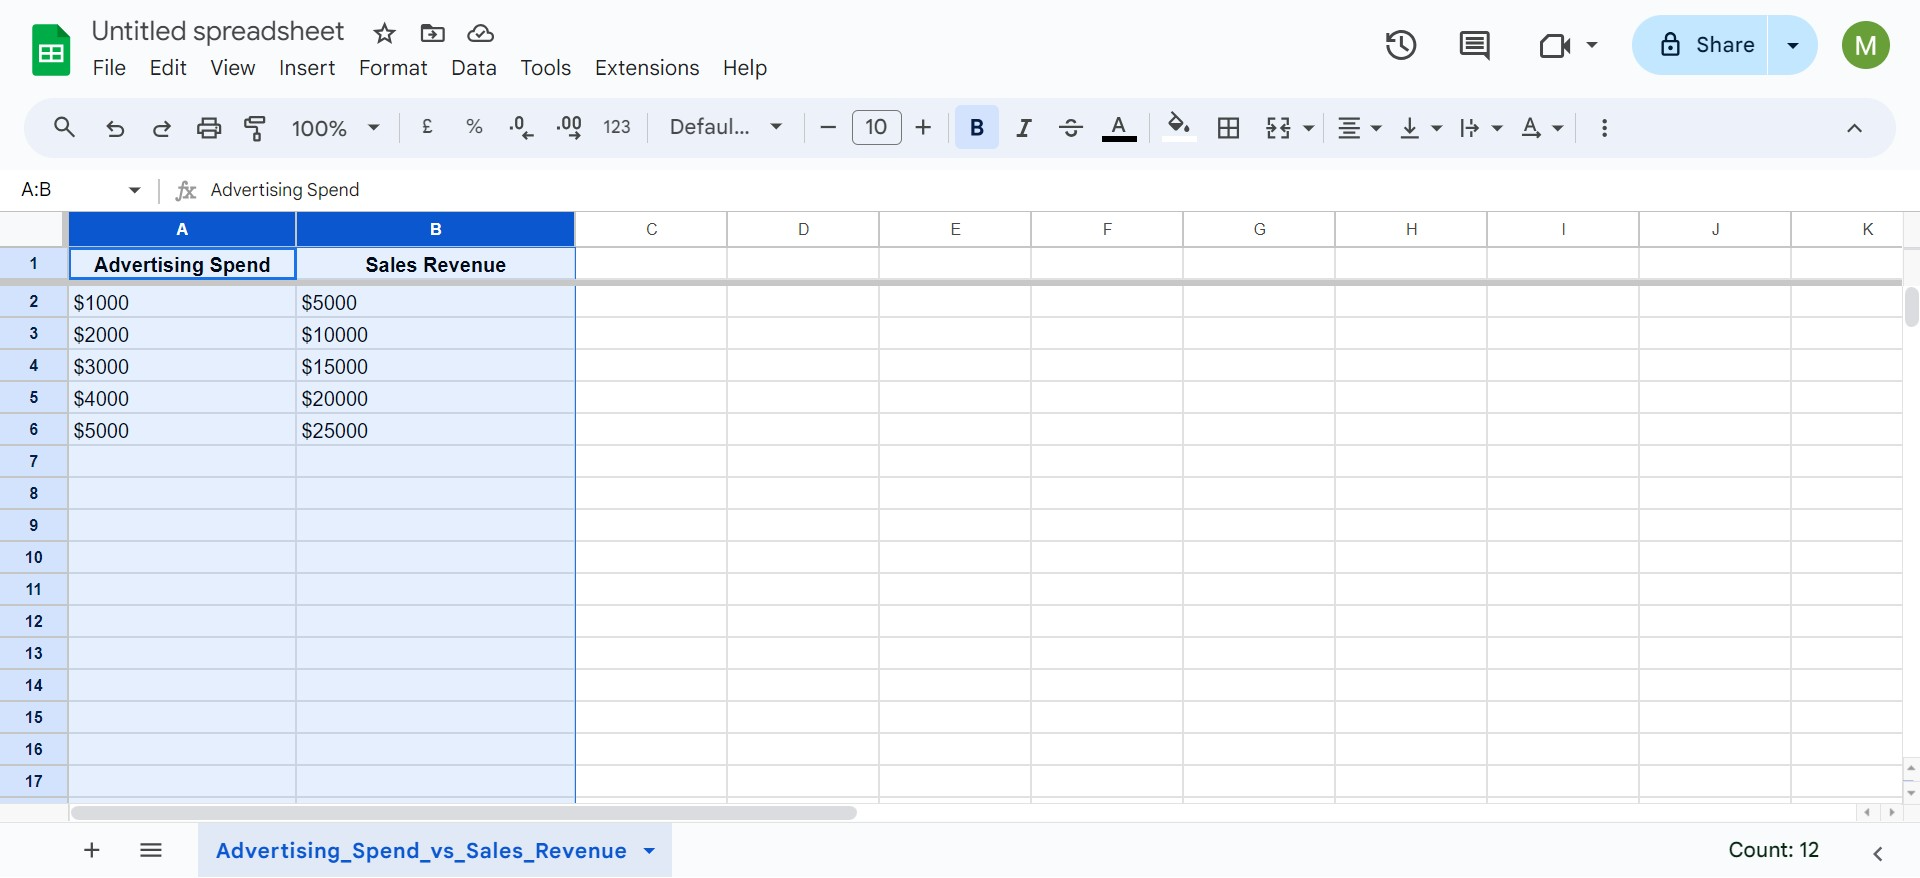
Step 2: Select Your Data
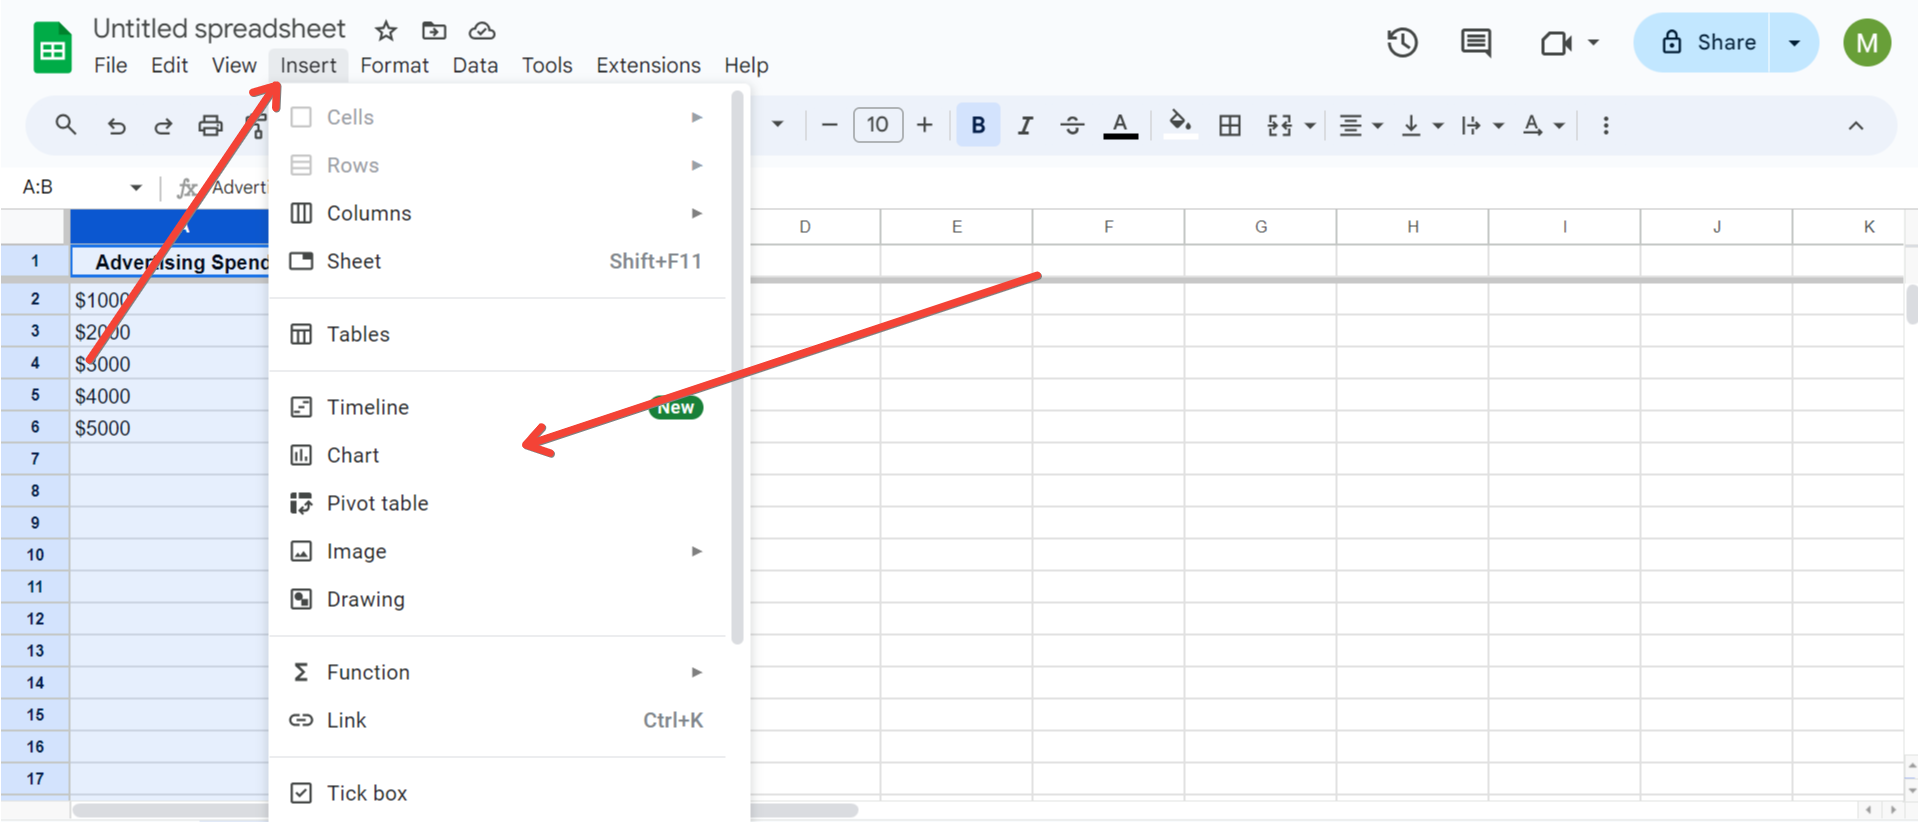
Step 3: Insert the Scatter Plot
Follow these steps to insert the scatter plot:
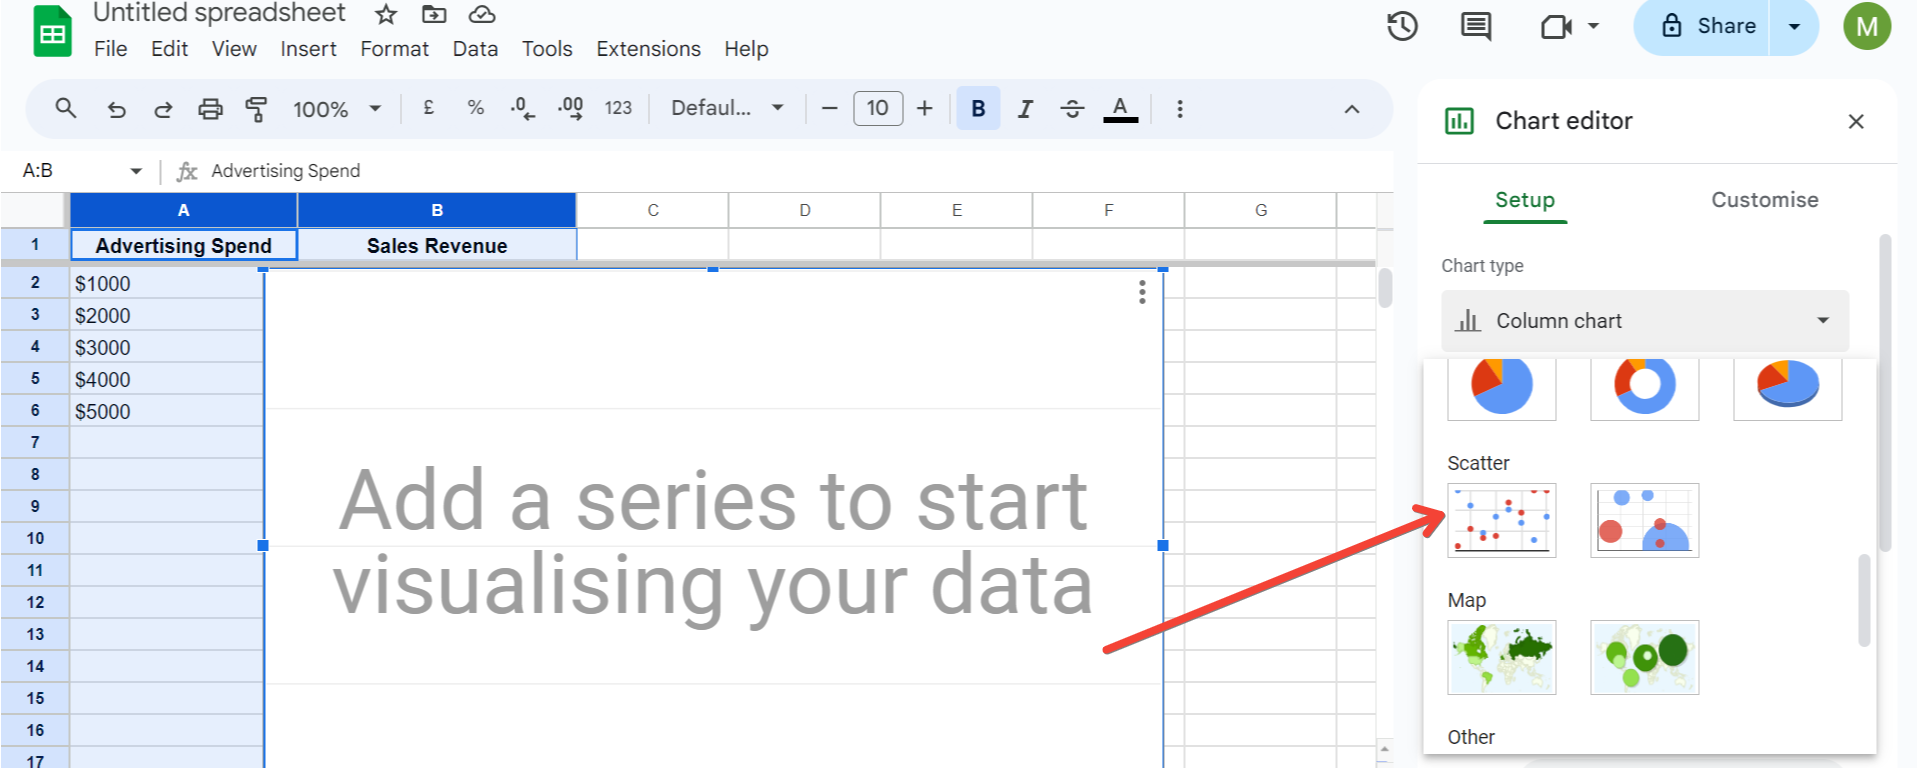
Step 4: Customize Your Scatter Plot
To refine your chart and make it more informative, consider adjusting the following elements:
Step 5: Analyze Your Scatter Plot
Examine the distribution of data points. A linear arrangement of the points suggests a correlation. The slope of the trendline can indicate the nature of the relationship, whether positive or negative.
Utilizing Advanced Tools Like SheetAI.app
While Google Sheets offers robust functionality, handling extensive datasets or performing complex statistical analysis can sometimes be cumbersome. This is where advanced tools like SheetAI.app can enhance your productivity. SheetAI.app integrates smoothly with Google Sheets, enabling enhanced data analysis capabilities, automation of repetitive tasks, and much more, without making your workflow overly complicated. This can be particularly helpful when dealing with large volumes of data or when you need to perform advanced statistical analysis frequently.
Conclusion
Creating a scatter plot in Google Sheets is straightforward but powerful for analyzing the relationships between variables. Whether you're in academia, science, business, or marketing, scatter plots can provide valuable insights into your data. Moreover, incorporating a tool like SheetAI.app can further optimize your data handling and analysis process, allowing you to focus more on strategic decisions and less on manual tasks.
Now that you know how to create and customize scatter plots in Google Sheets, you're well-equipped to start uncovering the stories hidden in your data.